
Hazard Maps – US Natural Disaster Risk Maps
Below you will find a series of maps that can help you determine the likelyhood of natural disasters in your area. This is extremely important information as you head down your preparedness journey, as it will help determine what natural disasters you should include in your Emergency Plan, and in turn what you should work on being prepared for. Below you will find individual and overlay maps for risks such as Earthquakes, Floods, Tornadoes and Hurricanes, along with US Population Density breakdowns by county (from the 2010 Census). Hopefully this information will help you be more informed of the possible natural disasters in your area and help you draft your Emergency Plan!
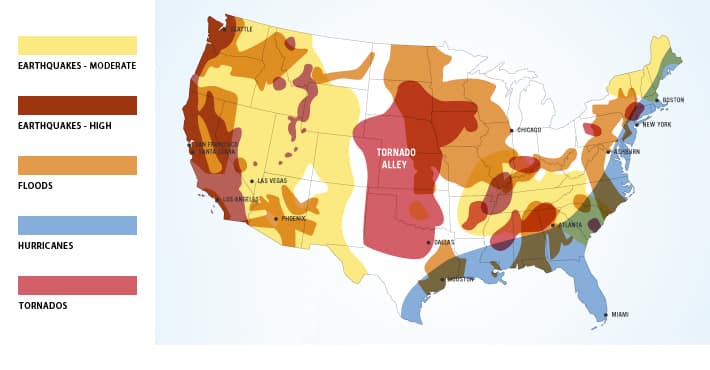
Combined Overlay - Natural Disasters
Earthquake Risk Map
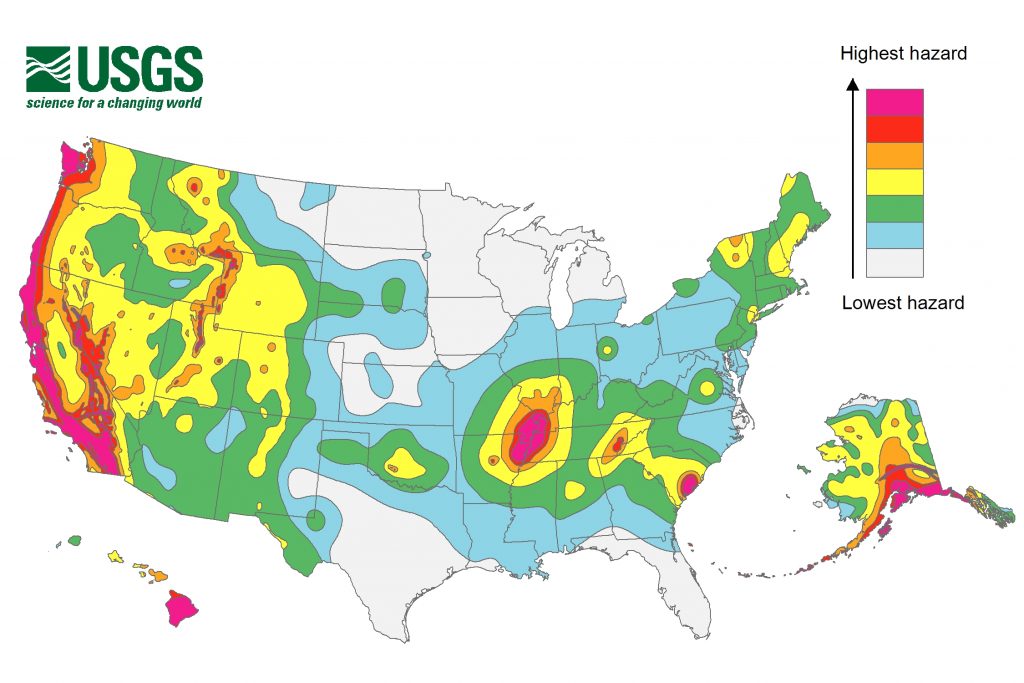
This map highlights Earthquake risk for the USA, based on US Geological Survey data.
Tornado Risk Map
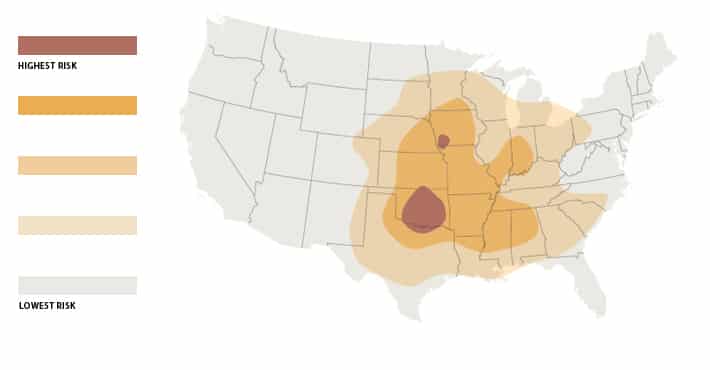
This map displays Tornado risk in the United States, based on data provided by National Oceanic and Atmospheric Administration
Hurricane Risk Map
This map displays highlights of the Hurricane risk in the continental US based on data provided by the University of Miami
US Population Density Map by County (2010 Census)
This is a US Population Density By County Map by County (2010 Census) provided by the U.S. Census Bureau.
Nuclear Facilities and Seismic Hazards Map
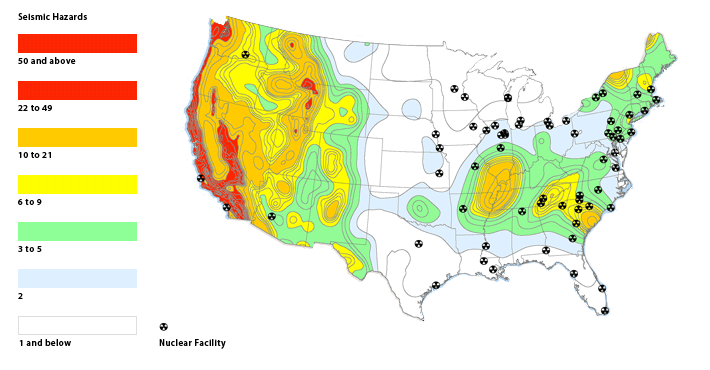
This map overlays Nuclear Facilities and Seismic Hazards. It shows areas of equal seismic hazard and indicates the minimum peak horizontal ground acceleration value, a measure of how hard the ground shakes in a given area. The map also shows locations of the 65 US nuclear facilities. The data comes from the US Geological Survey Geological Hazards Team and the US Energy Information Administration. It was compiled by Mike Meuser from Mapcruzin.com. According to Mike, as of March 2011 there are 65 operating nuclear power facilities in the U.S. Each facility has from 1 to 3 reactors for a total of 104 active reactors. This number does NOT account for those reactors that are decommissioned, reactors at research and university facilities, or all of the nuclear waste at various locations around the United States. Those are 104 active reactors!
The catastrophe at the Fukushima plant in Japan should serve as a lesson to the United States as well as Japan. The map below illustrates just how vulnerable we could be: many of the United States’s nuclear facilities are located near areas of seismic activity.
Subscribe to our Newsletter
Subscribe to our newsletter for for the latest information, Giveaway and Contest notifications!


